Grokking PyTorch Intel CPU performance from first principles
A case study on the TorchServe inference framework optimized with Intel® Extension for PyTorch*.
Authors: Min Jean Cho, Mark Saroufim
Reviewers: Ashok Emani, Jiong Gong
Getting a strong out-of-box performance for deep learning on CPUs can be tricky but it’s much easier if you’re aware of the main problems that affect performance, how to measure them and how to solve them.
TL;DR
Problem |
How to measure it |
Solution |
Bottlenecked GEMM execution units |
Avoid using logical cores by setting thread affinity to physical cores via core pinning |
|
Non Uniform Memory Access (NUMA) |
|
Avoid cross-socket computation by setting thread affinity to a specific socket via core pinning |
GEMM (General Matrix Multiply) run on fused-multiply-add (FMA) or dot-product (DP) execution units which will be bottlenecked and cause delays in thread waiting/spinning at synchronization barrier when hyperthreading is enabled - because using logical cores causes insufficient concurrency for all working threads as each logical thread contends for the same core resources. Instead, if we use 1 thread per physical core, we avoid this contention. So we generally recommend avoiding logical cores by setting CPU thread affinity to physical cores via core pinning.
Multi-socket systems have Non-Uniform Memory Access (NUMA) which is a shared memory architecture that describes the placement of main memory modules with respect to processors. But if a process is not NUMA-aware, slow remote memory is frequently accessed when threads migrate cross socket via Intel Ultra Path Interconnect (UPI) during run time. We address this problem by setting CPU thread affinity to a specific socket via core pinning.
Knowing these principles in mind, proper CPU runtime configuration can significantly boost out-of-box performance.
In this blog, we’ll walk you through the important runtime configurations you should be aware of from CPU Performance Tuning Guide, explain how they work, how to profile them and how to integrate them within a model serving framework like TorchServe via an easy to use launch script which we’ve integrated 1 natively.
We’ll explain all of these ideas visually from first principles with lots of profiles and show you how we applied our learnings to make out of the box CPU performance on TorchServe better.
The feature has to be explicitly enabled by setting cpu_launcher_enable=true in config.properties.
Avoid logical cores for deep learning
Avoiding logical cores for deep learning workloads generally improves performance. To understand this, let us take a step back to GEMM.
Optimizing GEMM optimizes deep learning
The majority of time in deep learning training or inference is spent on millions of repeated operations of GEMM which is at the core of fully connected layers. Fully connected layers have been used for decades since multi-layer perceptrons (MLP) proved to be a universal approximator of any continuous function. Any MLP can be entirely represented as GEMM. And even a convolution can be represented as a GEMM by using a Toepliz matrix.
Returning to the original topic, most GEMM operators benefit from using non-hyperthreading, because the majority of time in deep learning training or inference is spent on millions of repeated operations of GEMM running on fused-multiply-add (FMA) or dot-product (DP) execution units shared by hyperthreading cores. With hyperthreading enabled, OpenMP threads will contend for the same GEMM execution units.
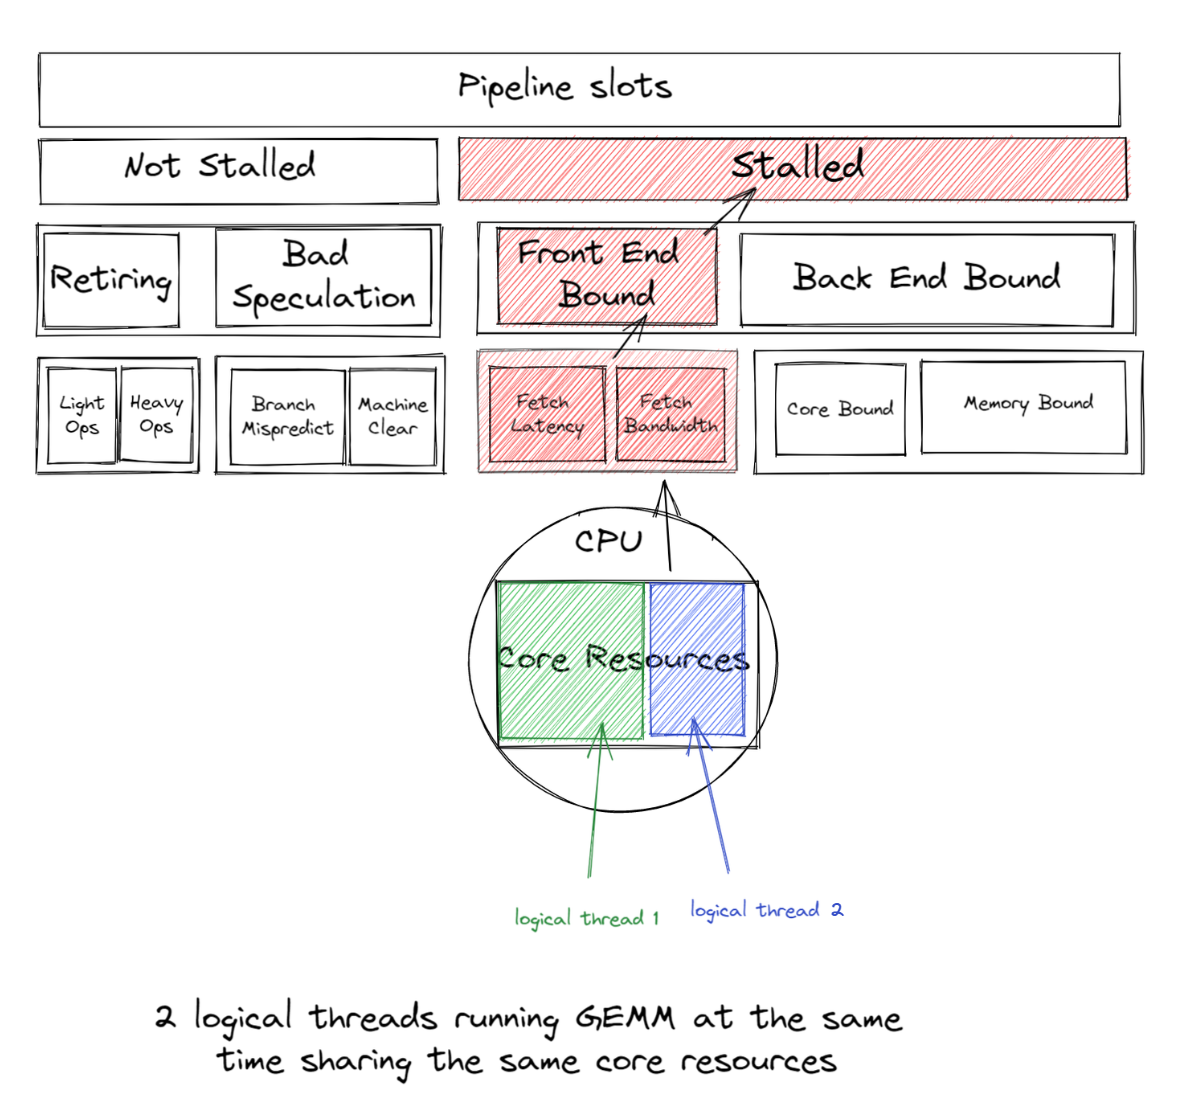
And if 2 logical threads run GEMM at the same time, they will be sharing the same core resources causing front end bound, such that the overhead from this front end bound is greater than the gain from running both logical threads at the same time.
Therefore we generally recommend avoiding using logical cores for deep learning workloads to achieve good performance. The launch script by default uses physical cores only; however, users can easily experiment with logical vs. physical cores by simply toggling the --use_logical_core launch script knob.
Exercise
We’ll use the following example of feeding ResNet50 dummy tensor:
import torch
import torchvision.models as models
import time

model = models.resnet50(pretrained=False)
model.eval()
data = torch.rand(1, 3, 224, 224)

# warm up
for _ in range(100):
    model(data)

start = time.time()
for _ in range(100):
    model(data)
end = time.time()
print('Inference took {:.2f} ms in average'.format((end-start)/100*1000))
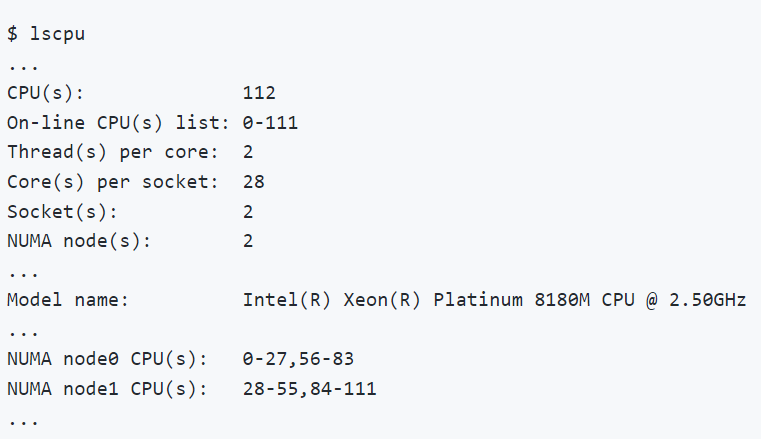
Throughout the blog, we’ll use Intel® VTune™ Profiler to profile and verify optimizations. And we’ll run all exercises on a machine with two Intel(R) Xeon(R) Platinum 8180M CPUs. The CPU information is shown in Figure 2.1.
Environment variable OMP_NUM_THREADS is used to set the number of threads for parallel region. We’ll compare OMP_NUM_THREADS=2 with (1) use of logical cores and (2) use of physical cores only.
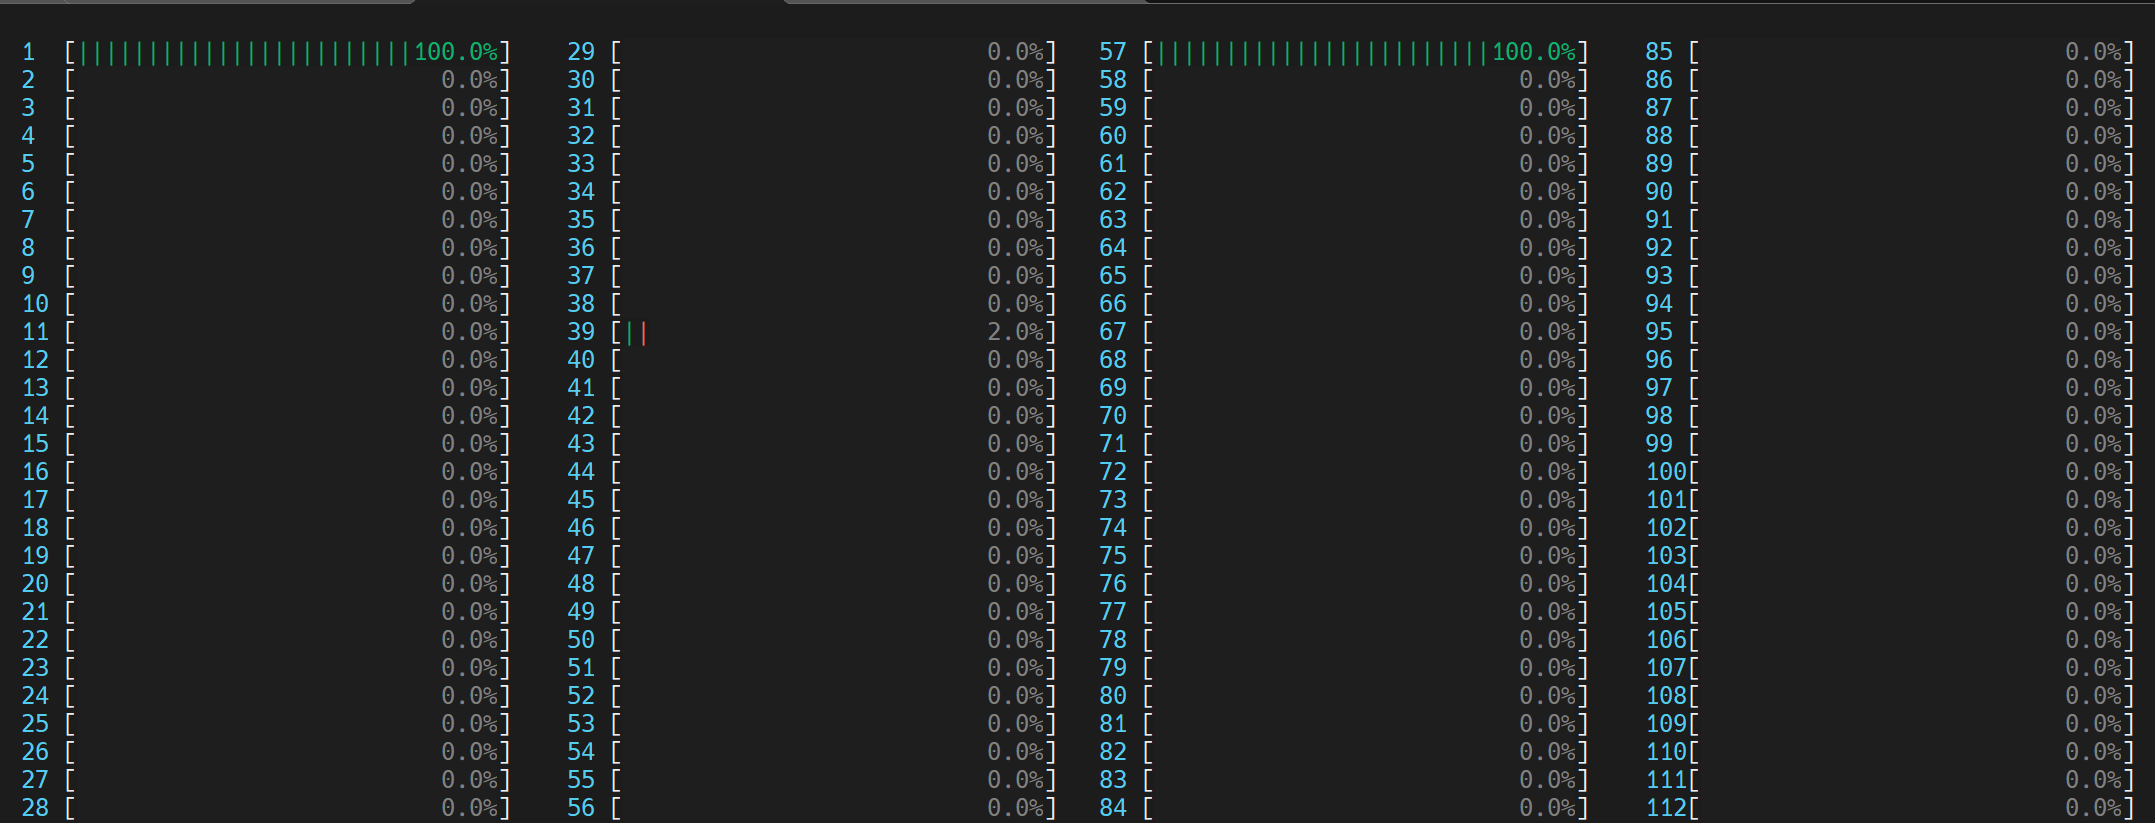
Both OpenMP threads trying to utilize the same GEMM execution units shared by hyperthreading cores (0, 56)
We can visualize this by running htop command on Linux as shown below.
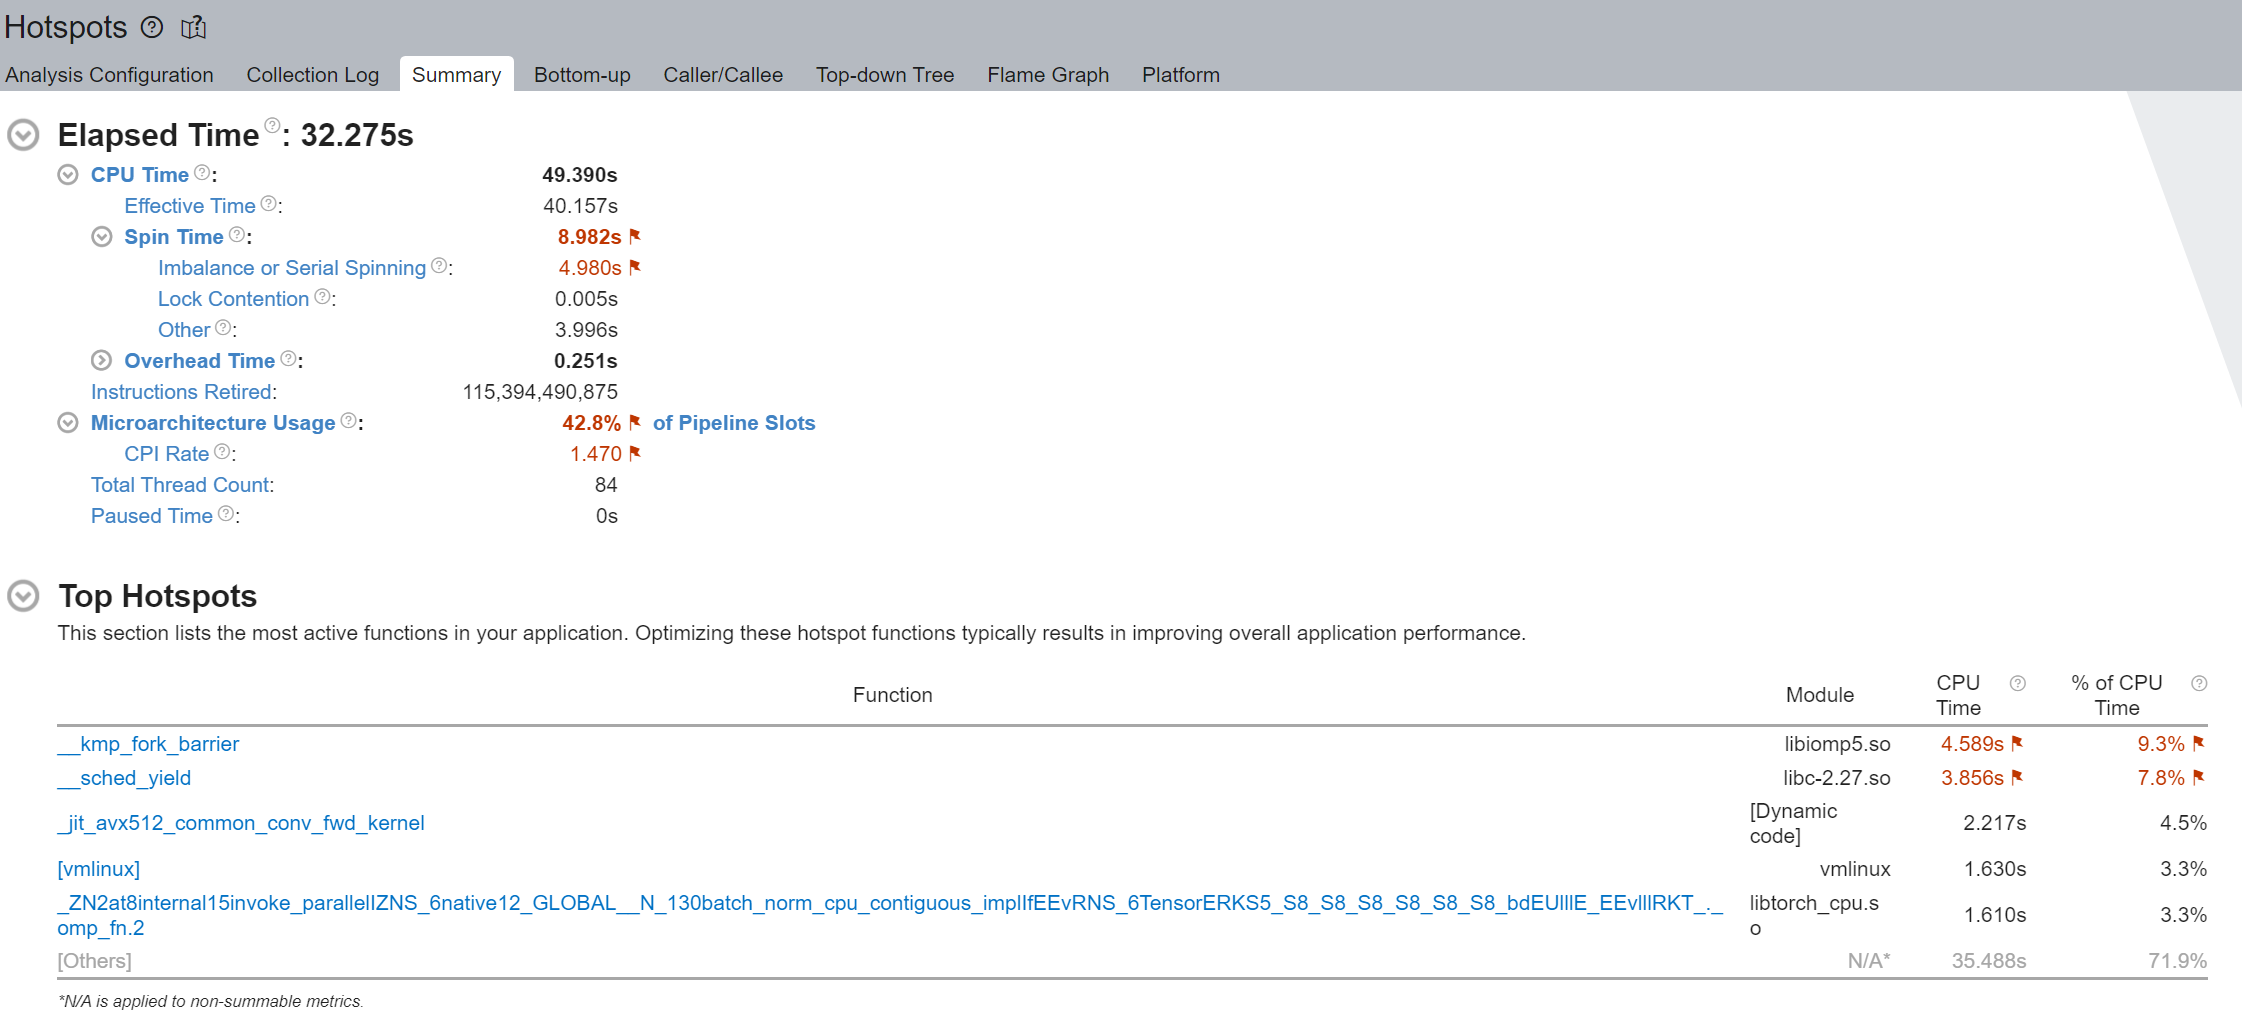
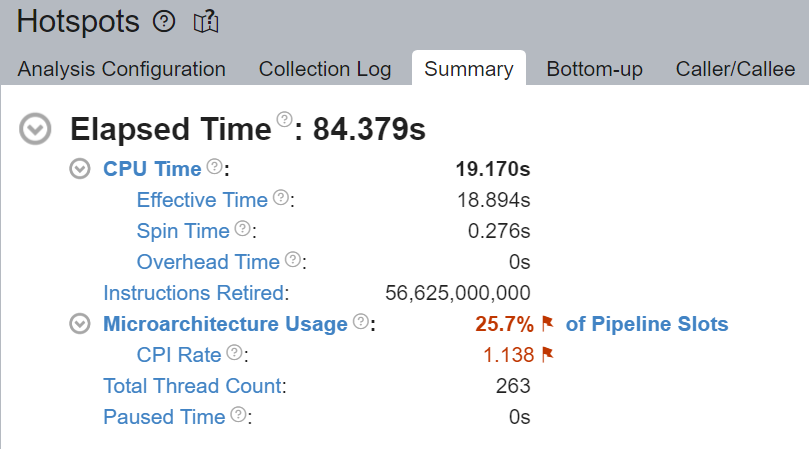
We notice that the Spin Time is flagged, and Imbalance or Serial Spinning contributed to the majority of it - 4.980 seconds out of the 8.982 seconds total. The Imbalance or Serial Spinning when using logical cores is due to insufficient concurrency of working threads as each logical thread contends for the same core resources.
The Top Hotspots section of the execution summary indicates that __kmp_fork_barrier took 4.589 seconds of CPU time - during 9.33% of the CPU execution time, threads were just spinning at this barrier due to thread synchronization.
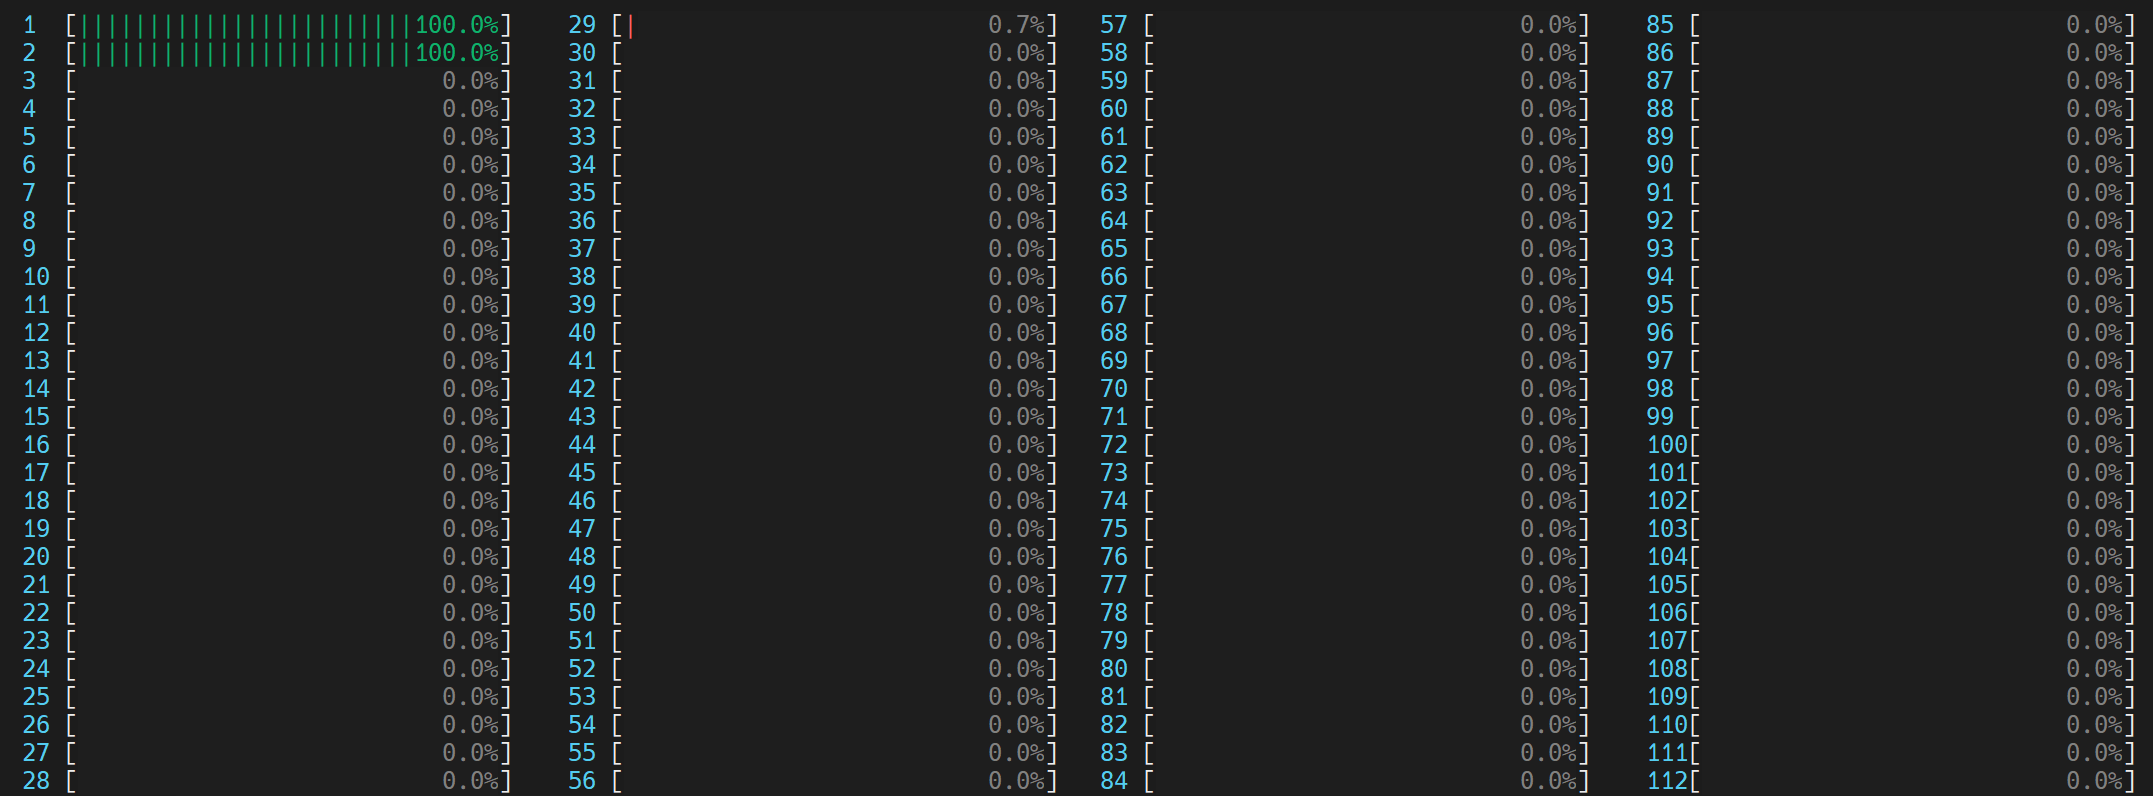
Each OpenMP thread utilizing GEMM execution units in respective physical cores (0,1)
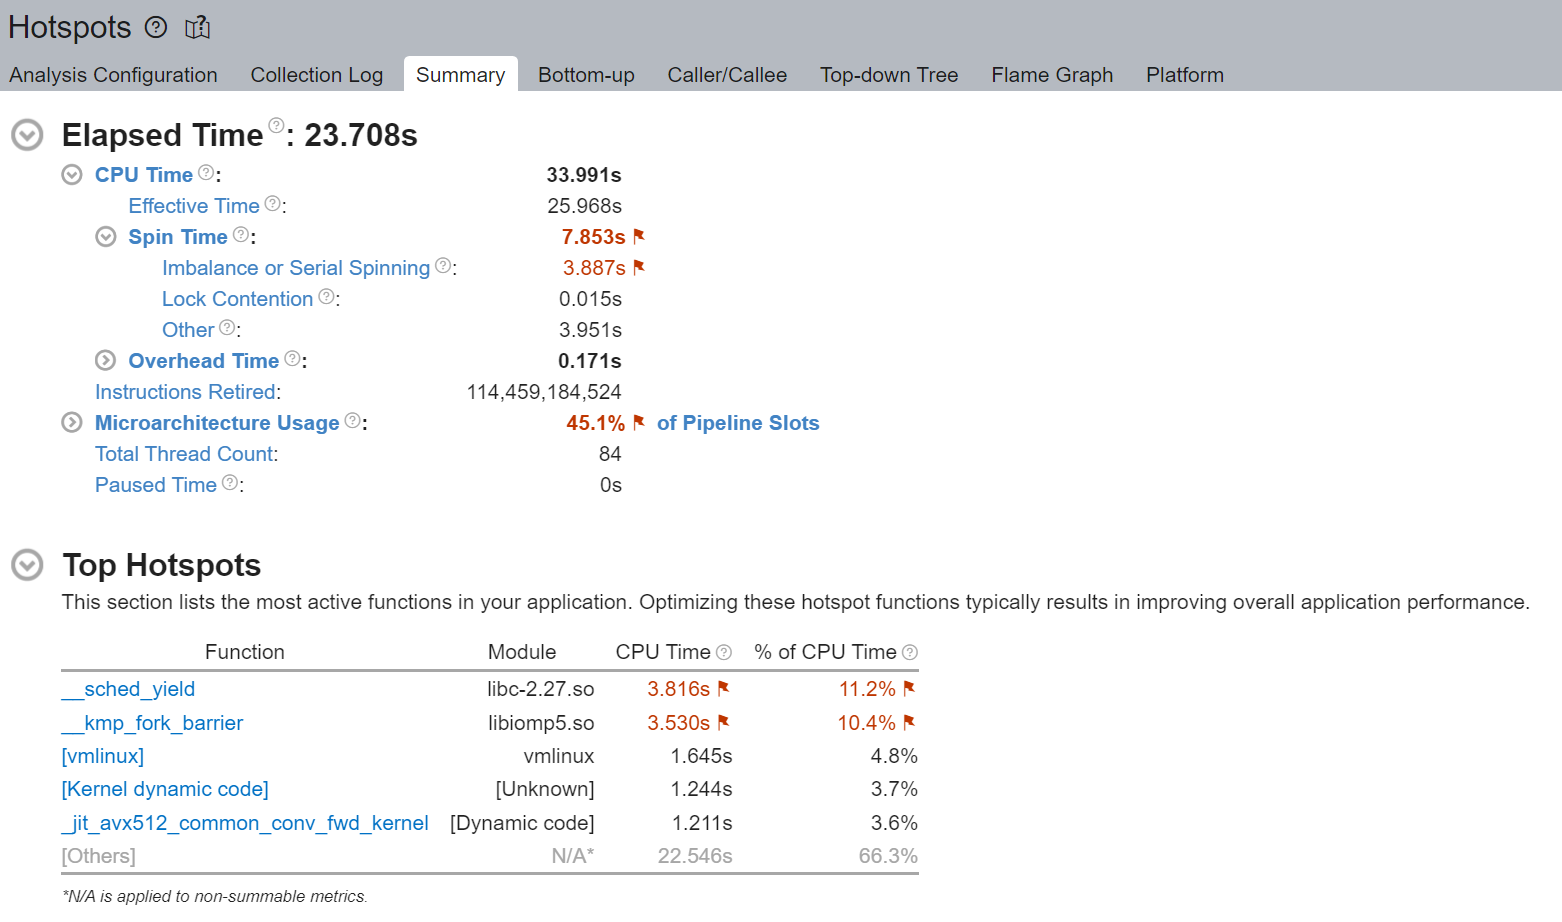
We first note that the execution time dropped from 32 seconds to 23 seconds by avoiding logical cores. While there’s still some non-negligible Imbalance or Serial Spinning, we note relative improvement from 4.980 seconds to 3.887 seconds.
By not using logical threads (instead, using 1 thread per physical core), we avoid logical threads contending for the same core resources. The Top Hotspots section also indicates relative improvement of __kmp_fork_barrier time from 4.589 seconds to 3.530 seconds.
Local memory access is always faster than remote memory access
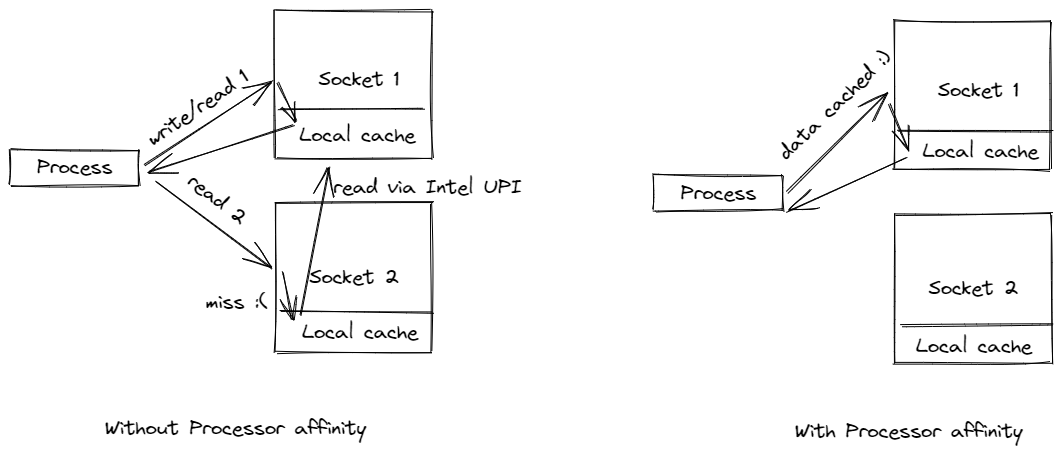
We generally recommend binding a process to a local socket such that the process does not migrate across sockets. Generally the goal of doing so is to utilize high speed cache on local memory and to avoid remote memory access which can be ~2x slower.
Figure 1. Two-socket configuration
Figure 1. shows a typical two-socket configuration. Notice that each socket has its own local memory. Sockets are connected to each other via Intel Ultra Path Interconnect (UPI) which allows each socket to access the local memory of another socket called remote memory. Local memory access is always faster than remote memory access.
Figure 2.1. CPU information
Users can get their CPU information by running lscpu command on their Linux machine. Figure 2.1. shows an example of lscpu execution on a machine with two Intel(R) Xeon(R) Platinum 8180M CPUs. Notice that there are 28 cores per socket, and 2 threads per core (i.e., hyperthreading is enabled). In other words, there are 28 logical cores in addition to 28 physical cores, giving a total of 56 cores per socket. And there are 2 sockets, giving a total of 112 cores (Thread(s) per core x Core(s) per socket x Socket(s)).
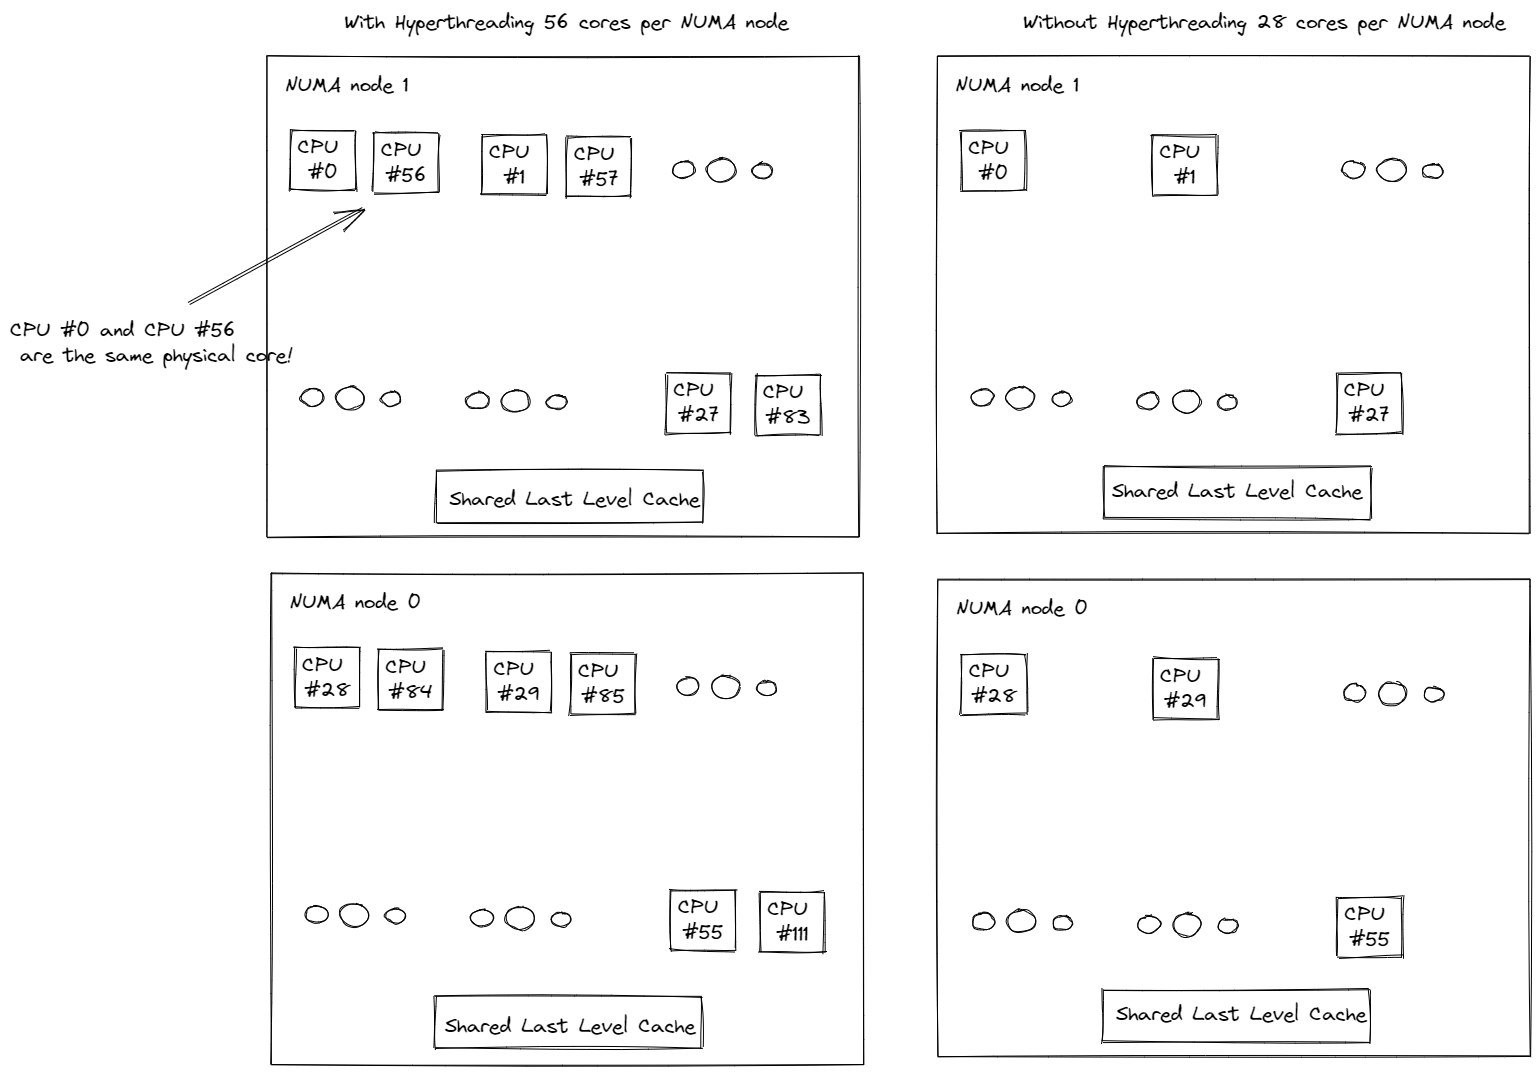
Figure 2.2. CPU information
The 2 sockets are mapped to 2 NUMA nodes (NUMA node 0, NUMA node 1) respectively. Physical cores are indexed prior to logical cores. As shown in Figure 2.2., the first 28 physical cores (0-27) and the first 28 logical cores (56-83) on the first socket are on NUMA node 0. And the second 28 physical cores (28-55) and the second 28 logical cores (84-111) on the second socket are on NUMA node 1. Cores on the same socket share local memory and last level cache (LLC) which is much faster than cross-socket communication via Intel UPI.
Now that we understand NUMA, cross-socket (UPI) traffic, local vs. remote memory access in multi-processor systems, let’s profile and verify our understanding.
Exercise
We’ll reuse the ResNet50 example above.
As we did not pin threads to processor cores of a specific socket, the operating system periodically schedules threads on processor cores located in different sockets.
Figure 3. CPU usage of non NUMA-aware application. 1 main worker thread was launched, then it launched a physical core number (56) of threads on all cores, including logical cores.
(Aside: If the number of threads is not set by torch.set_num_threads, the default number of threads is the number of physical cores in a hyperthreading enabled system. This can be verified by torch.get_num_threads. Hence we see above about half of the cores busy running the example script.)
Figure 4. Non-Uniform Memory Access Analysis graph
Figure 4. compares local vs. remote memory access over time. We verify usage of remote memory which could result in sub-optimal performance.
Set thread affinity to reduce remote memory access and cross-socket (UPI) traffic
Pinning threads to cores on the same socket helps maintain locality of memory access. In this example, we’ll pin to the physical cores on the first NUMA node (0-27). With the launch script, users can easily experiment with NUMA nodes configuration by simply toggling the --node_id launch script knob.
Let’s visualize the CPU usage now.
Figure 5. CPU usage of NUMA-aware application
1 main worker thread was launched, then it launched threads on all physical cores on the first numa node.
Figure 6. Non-Uniform Memory Access Analysis graph
As shown in Figure 6., now almost all memory accesses are local accesses.
Efficient CPU usage with core pinning for multi-worker inference
When running multi-worker inference, cores are overlapped (or shared) between workers causing inefficient CPU usage. To address this problem, the launch script equally divides the number of available cores by the number of workers such that each worker is pinned to assigned cores during runtime.
Exercise with TorchServe
For this exercise, let’s apply the CPU performance tuning principles and recommendations that we have discussed so far to TorchServe apache-bench benchmarking.
We’ll use ResNet50 with 4 workers, concurrency 100, requests 10,000. All other parameters (e.g., batch_size, input, etc) are the same as the default parameters.
We’ll compare the following three configurations:
default TorchServe setting (no core pinning)
torch.set_num_threads =
number of physical cores / number of workers(no core pinning)core pinning via the launch script (Required Torchserve>=0.6.1)
After this exercise, we’ll have verified that we prefer avoiding logical cores and prefer local memory access via core pinning with a real TorchServe use case.
1. Default TorchServe setting (no core pinning)
The base_handler doesn’t explicitly set torch.set_num_threads. Hence the default number of threads is the number of physical CPU cores as described here. Users can check the number of threads by torch.get_num_threads in the base_handler. Each of the 4 main worker threads launches a physical core number (56) of threads, launching a total of 56x4 = 224 threads, which is more than the total number of cores 112. Therefore cores are guaranteed to be heavily overlapped with high logical core utilization- multiple workers using multiple cores at the same time. Furthermore, because threads are not affinitized to specific CPU cores, the operating system periodically schedules threads to cores located in different sockets.
CPU usage
4 main worker threads were launched, then each launched a physical core number (56) of threads on all cores, including logical cores.
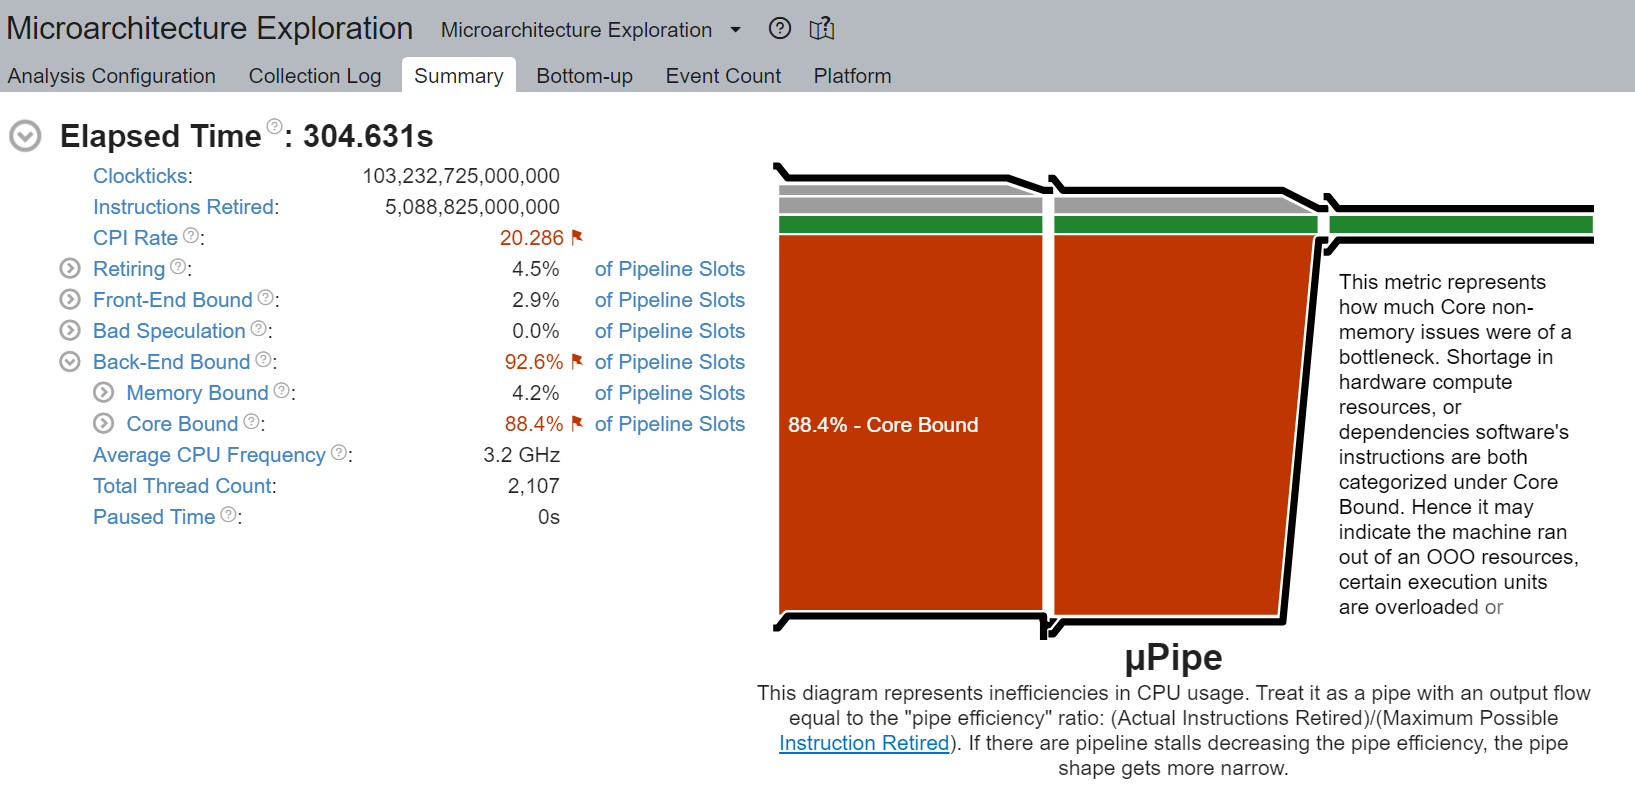
Core Bound stalls
We observe a very high Core Bound stall of 88.4%, decreasing pipeline efficiency. Core Bound stalls indicate sub-optimal use of available execution units in the CPU. For example, several GEMM instructions in a row competing for fused-multiply-add (FMA) or dot-product (DP) execution units shared by hyperthreading cores could cause Core Bound stalls. And as described in the previous section, use of logical cores amplifies this problem.
An empty pipeline slot not filled with micro-ops (uOps) is attributed to a stall. For example, without core pinning CPU usage may not effectively be on compute but on other operations like thread scheduling from Linux kernel. We see above that __sched_yield contributed to the majority of the Spin Time.
Thread Migration
Without core pinning, scheduler may migrate thread executing on a core to a different core. Thread migration can disassociate the thread from data that has already been fetched into the caches resulting in longer data access latencies. This problem is exacerbated in NUMA systems when thread migrates across sockets. Data that has been fetched to high speed cache on local memory now becomes remote memory, which is much slower.
Generally the total number of threads should be less than or equal to the total number of threads supported by the core. In the above example, we notice a large number of threads executing on core_51 instead of the expected 2 threads (since hyperthreading is enabled in Intel(R) Xeon(R) Platinum 8180 CPUs) . This indicates thread migration.
Additionally, notice that thread (TID:97097) was executing on a large number of CPU cores, indicating CPU migration. For example, this thread was executing on cpu_81, then migrated to cpu_14, then migrated to cpu_5, and so on. Furthermore, note that this thread migrated cross socket back and forth many times, resulting in very inefficient memory access. For example, this thread executed on cpu_70 (NUMA node 0), then migrated to cpu_100 (NUMA node 1), then migrated to cpu_24 (NUMA node 0).
Non Uniform Memory Access Analysis
Compare local vs. remote memory access over time. We observe that about half, 51.09%, of the memory accesses were remote accesses, indicating sub-optimal NUMA configuration.
2. torch.set_num_threads = number of physical cores / number of workers (no core pinning)
For an apple-to-apple comparison with launcher’s core pinning, we’ll set the number of threads to the number of cores divided by the number of workers (launcher does this internally). Add the following code snippet in the base_handler:
torch.set_num_threads(num_physical_cores/num_workers)
As before without core pinning, these threads are not affinitized to specific CPU cores, causing the operating system to periodically schedule threads on cores located in different sockets.
CPU usage
4 main worker threads were launched, then each launched a num_physical_cores/num_workers number (14) of threads on all cores, including logical cores.
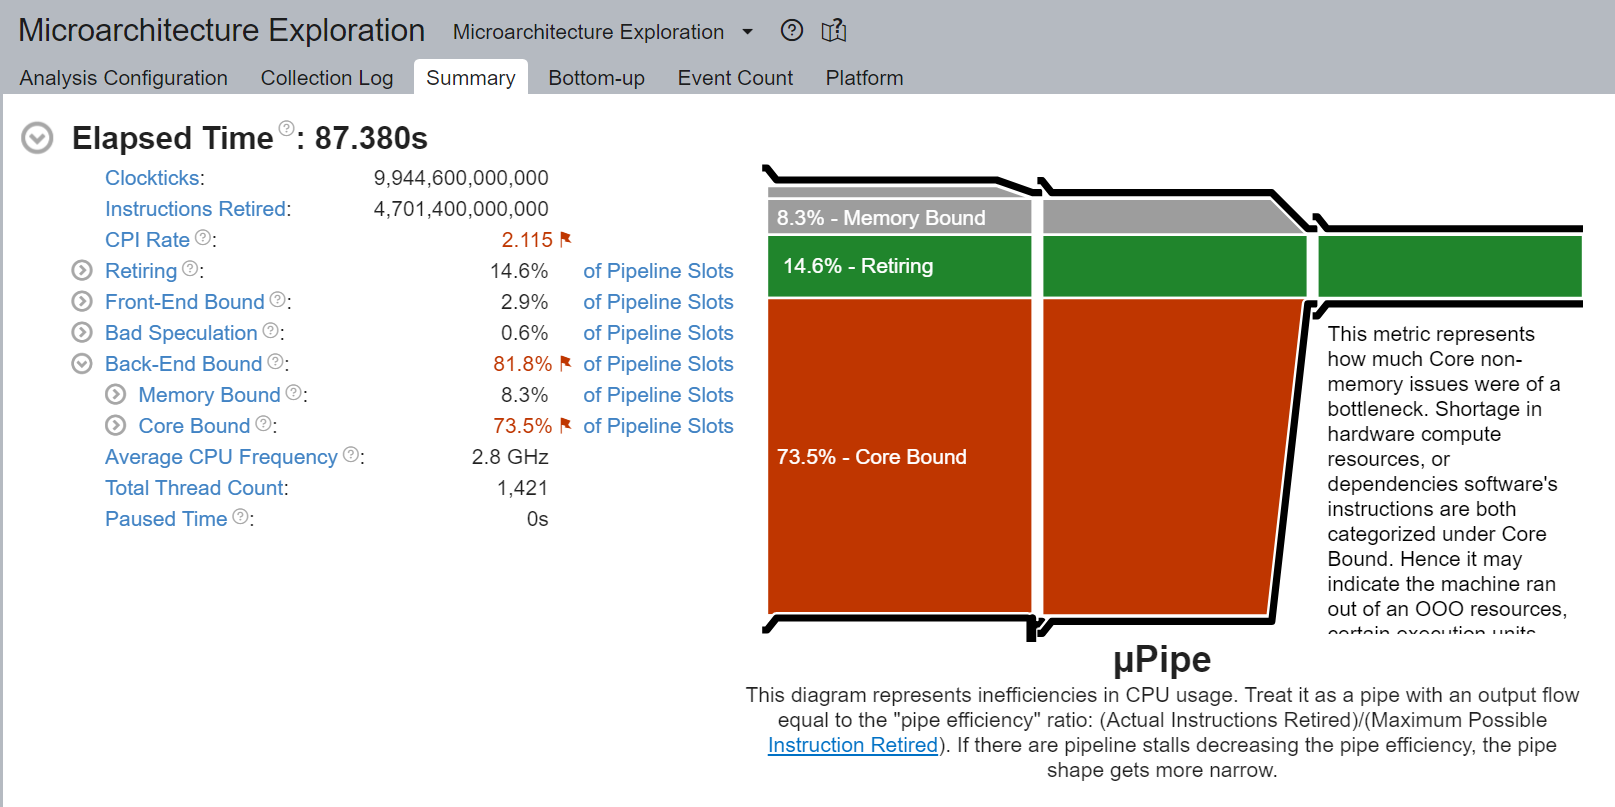
Core Bound stalls
Although the percentage of Core Bound stalls has decreased from 88.4% to 73.5%, the Core Bound is still very high.
Thread Migration
Similar as before, without core pinning thread (TID:94290) was executing on a large number of CPU cores, indicating CPU migration. We notice again cross-socket thread migration, resulting in very inefficient memory access. For example, this thread executed on cpu_78 (NUMA node 0), then migrated to cpu_108 (NUMA node 1).
Non Uniform Memory Access Analysis
Although an improvement from the original 51.09%, still 40.45% of memory access is remote, indicating sub-optimal NUMA configuration.
3. launcher core pinning
Launcher will internally equally distribute physical cores to workers, and bind them to each worker. As a reminder, launcher by default uses physical cores only. In this example, launcher will bind worker 0 to cores 0-13 (NUMA node 0), worker 1 to cores 14-27 (NUMA node 0), worker 2 to cores 28-41 (NUMA node 1), and worker 3 to cores 42-55 (NUMA node 1). Doing so ensures that cores are not overlapped among workers and avoids logical core usage.
CPU usage
4 main worker threads were launched, then each launched a num_physical_cores/num_workers number (14) of threads affinitized to the assigned physical cores.
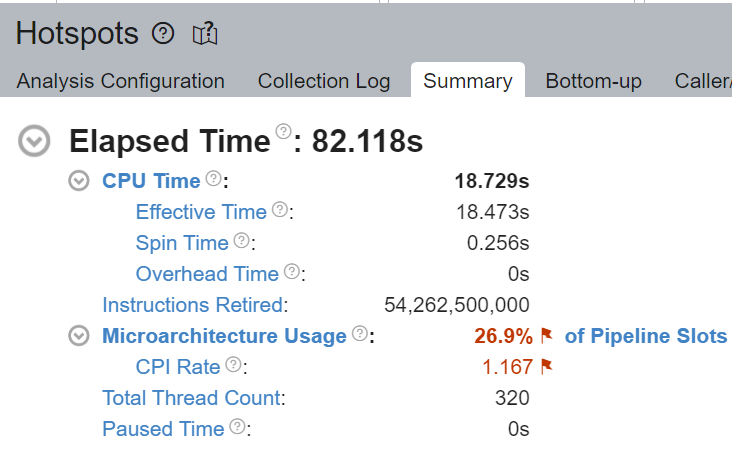
Core Bound stalls
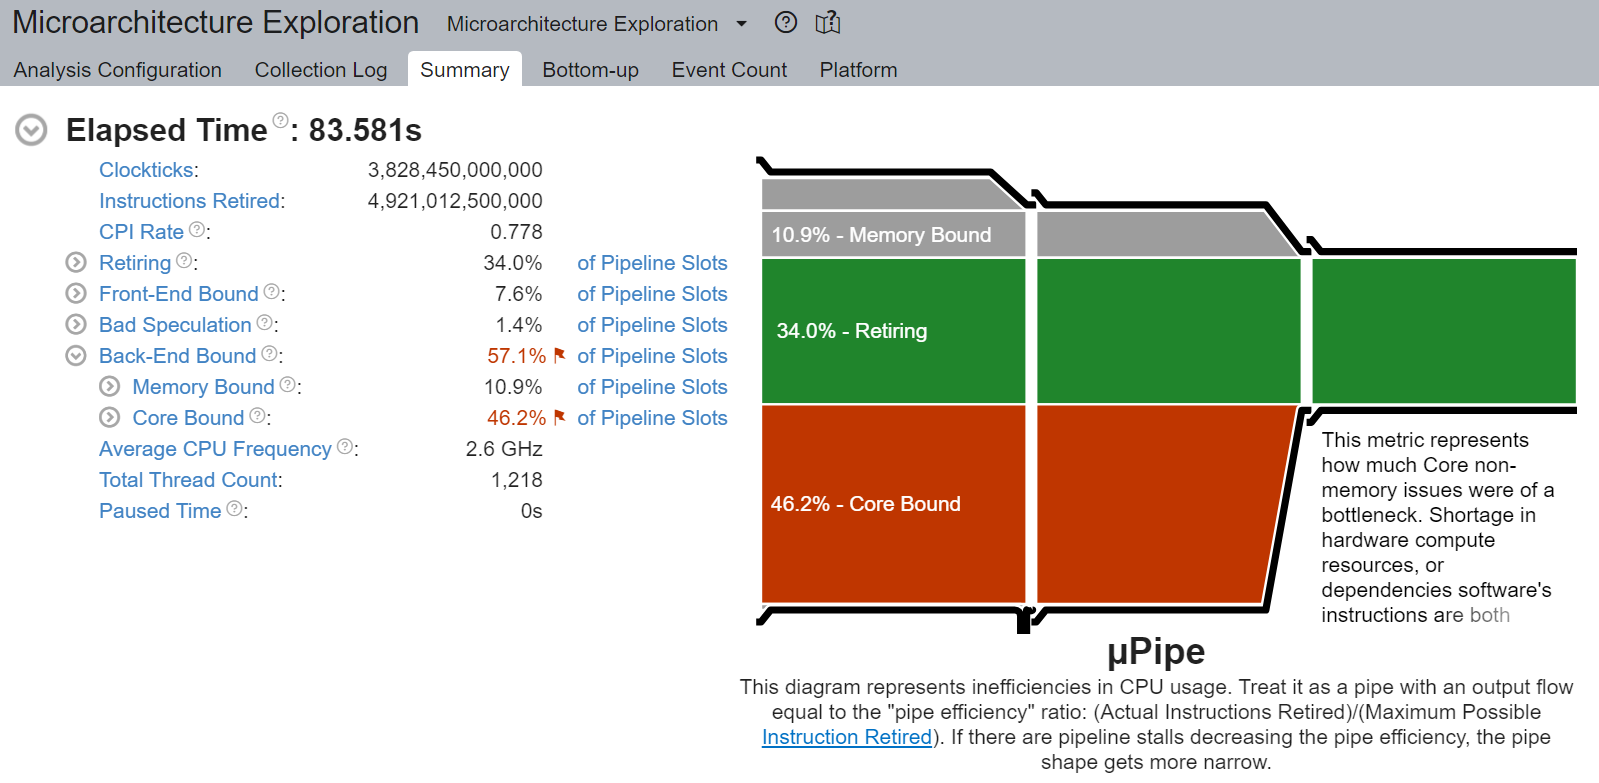
Core Bound stalls has decreased significantly from the original 88.4% to 46.2% - almost a 2x improvement.
We verify that with core binding, most CPU time is effectively used on compute - Spin Time of 0.256s.
Thread Migration
We verify that OMP Primary Thread #0 was bound to assigned physical cores (42-55), and did not migrate cross-socket.
Non Uniform Memory Access Analysis
Now almost all, 89.52%, memory accesses are local accesses.
Conclusion
In this blog, we’ve showcased that properly setting your CPU runtime configuration can significantly boost out-of-box CPU performance.
We have walked through some general CPU performance tuning principles and recommendations:
In a hyperthreading enabled system, avoid logical cores by setting thread affinity to physical cores only via core pinning.
In a multi-socket system with NUMA, avoid cross-socket remote memory access by setting thread affinity to a specific socket via core pinning.
We have visually explained these ideas from first principles and have verified the performance boost with profiling. And finally, we have applied all of our learnings to TorchServe to boost out-of-box TorchServe CPU performance.
These principles can be automatically configured via an easy to use launch script which has already been integrated into TorchServe.
For interested readers, please check out the following documents:
And stay tuned for a follow-up posts on optimized kernels on CPU via Intel® Extension for PyTorch* and advanced launcher configurations such as memory allocator.
Acknowledgement
We would like to thank Ashok Emani (Intel) and Jiong Gong (Intel) for their immense guidance and support, and thorough feedback and reviews throughout many steps of this blog. We would also like to thank Hamid Shojanazeri (Meta), Li Ning (AWS) and Jing Xu (Intel) for helpful feedback in code review. And Suraj Subramanian (Meta) and Geeta Chauhan (Meta) for helpful feedback on the blog.


