Grokking PyTorch Intel CPU performance from first principles (Part 2)
Authors: Min Jean Cho, Jing Xu, Mark Saroufim
In the Grokking PyTorch Intel CPU Performance From First Principles tutorial , we have introduced how to tune CPU runtime configurations, how to profile them, and how to integrate them into TorchServe for optimized CPU performance.
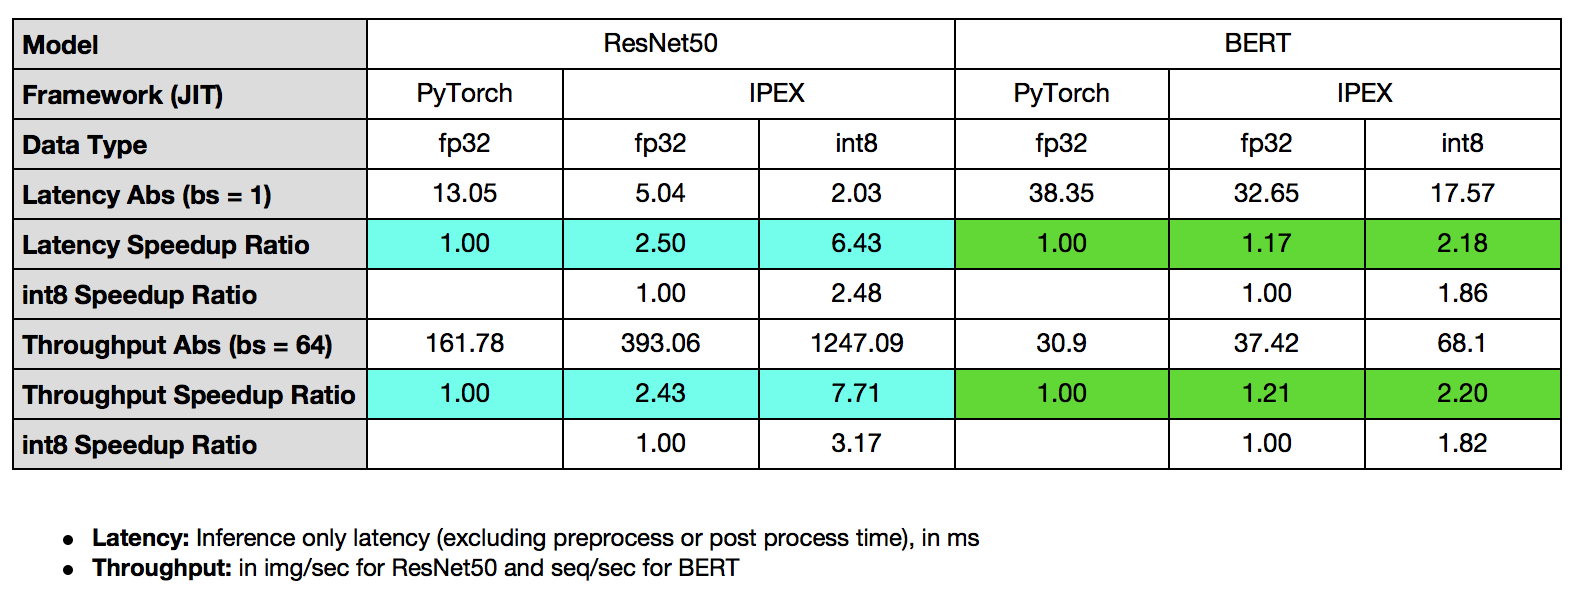
In this tutorial, we will demonstrate boosting performance with memory allocator via the Intel® Extension for PyTorch* Launcher , and optimized kernels on CPU via Intel® Extension for PyTorch* , and apply them to TorchServe showcasing 7.71x throughput speedup for ResNet50 and 2.20x throughput speedup for BERT.
Prerequisites
Throughout this tutorial, we will use Top-down Microarchitecture Analysis (TMA) to profile and show that the Back End Bound (Memory Bound, Core Bound) is often the primary bottleneck for under-optimized or under-tuned deep learning workloads, and demonstrate optimization techniques via Intel® Extension for PyTorch* for improving Back End Bound. We will use toplev, a tool part of pmu-tools built on top of Linux perf, for TMA.
We will also use Intel® VTune™ Profiler’s Instrumentation and Tracing Technology (ITT) to profile at finer granularity.
Top-down Microarchitecture Analysis Method (TMA)
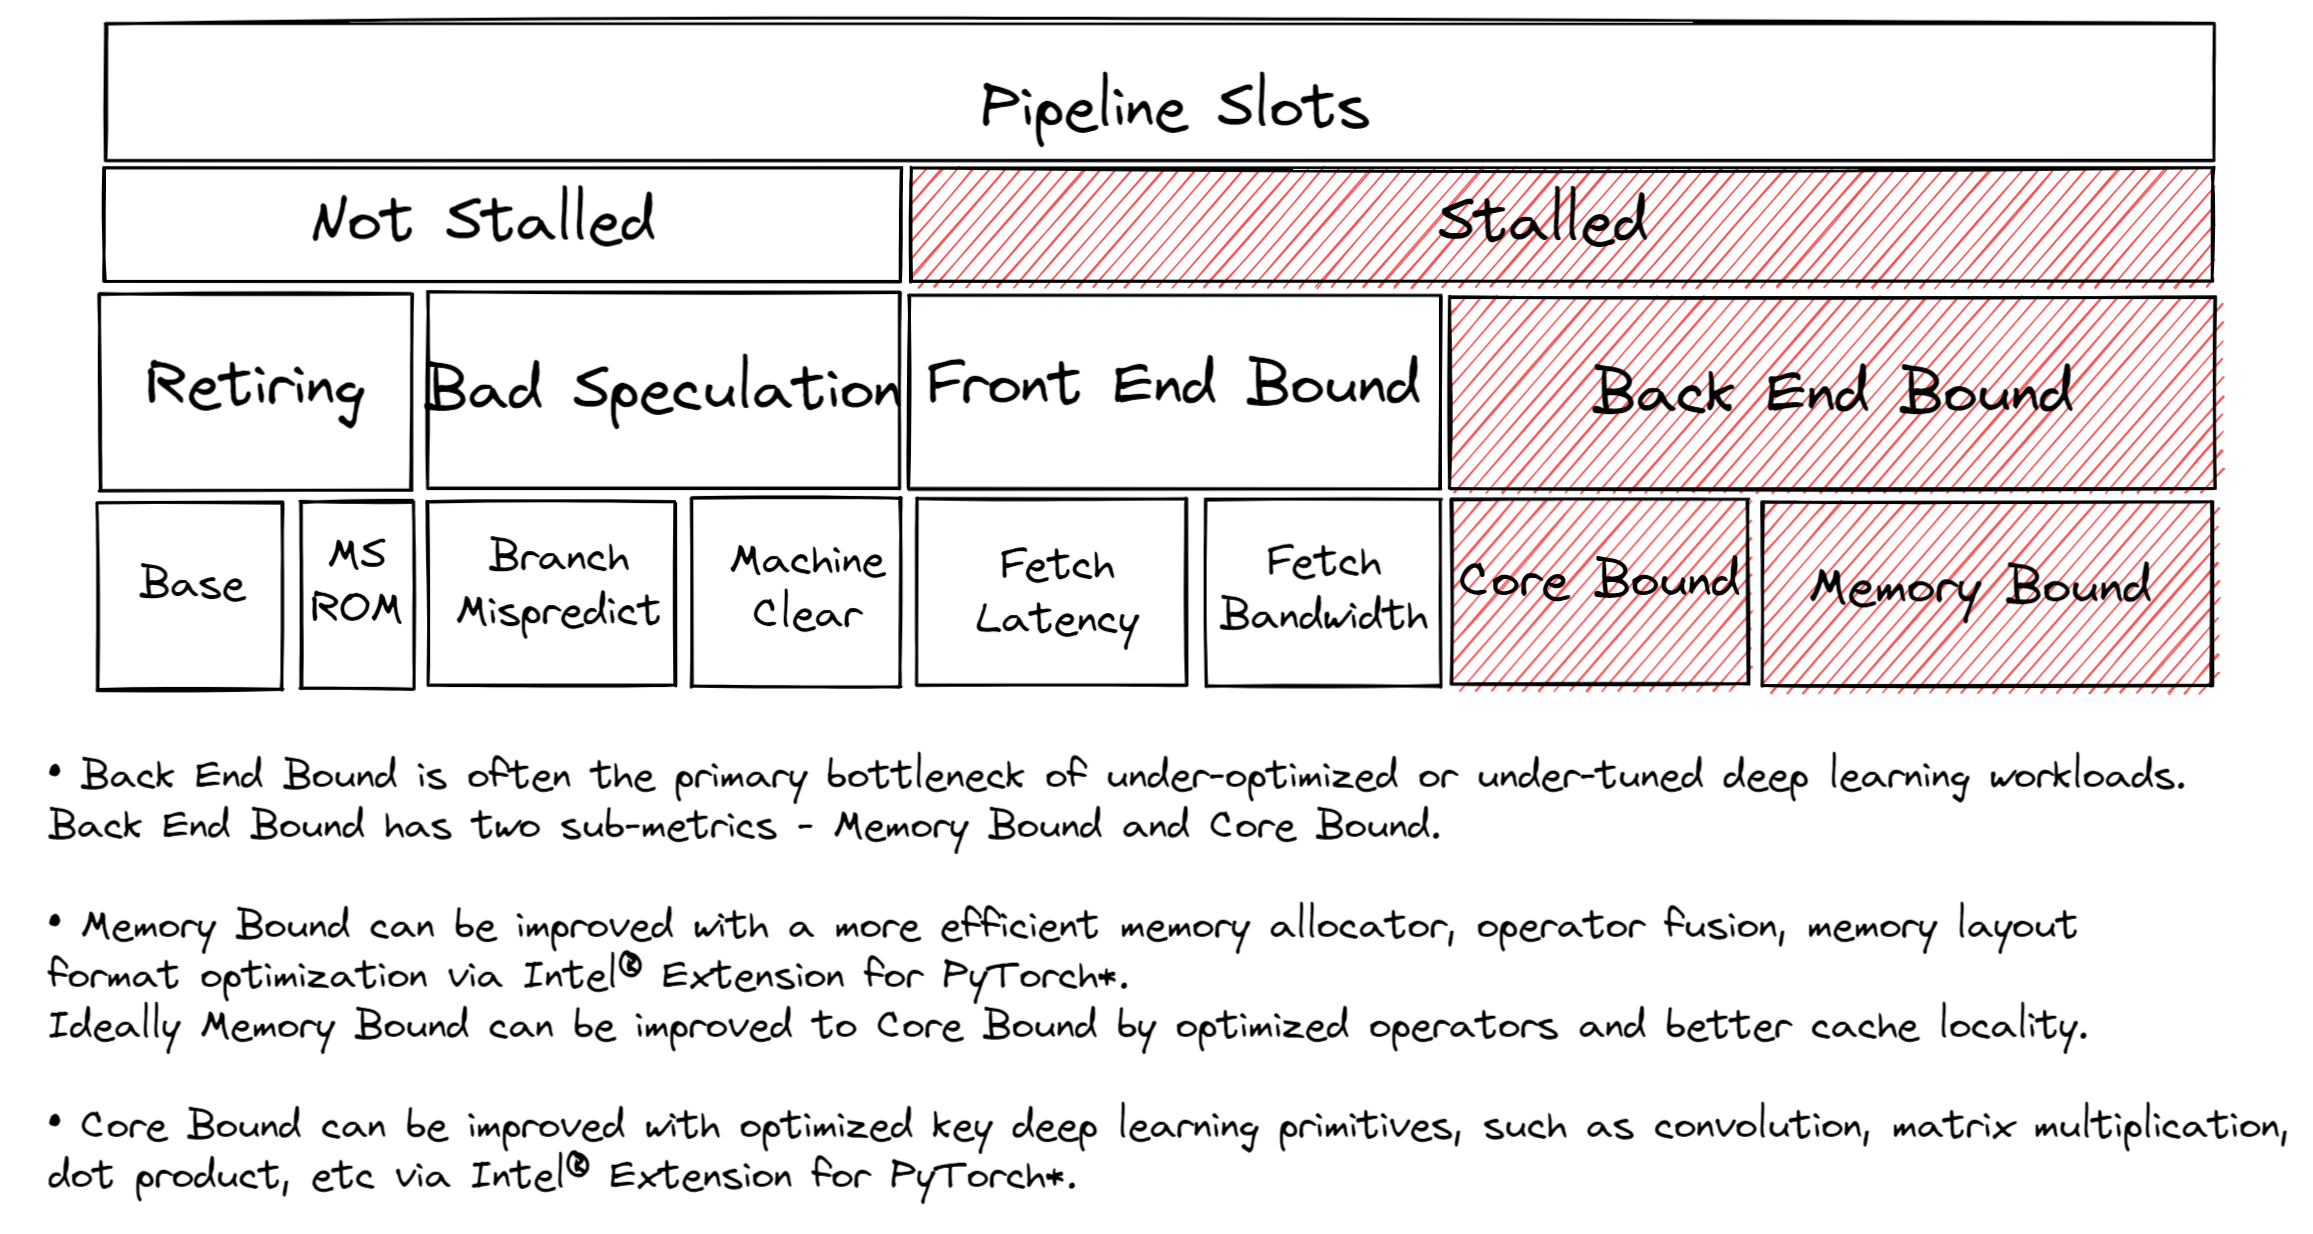
When tuning CPU for optimal performance, it’s useful to know where the bottleneck is. Most CPU cores have on-chip Performance Monitoring Units (PMUs). PMUs are dedicated pieces of logic within a CPU core that count specific hardware events as they occur on the system. Examples of these events may be Cache Misses or Branch Mispredictions. PMUs are used for Top-down Microarchitecture Analysis (TMA) to identify the bottlenecks. TMA consists of hierarchical levels as shown:
The top level, level-1, metrics collect Retiring, Bad Speculation, Front End Bound, Back End Bound. The pipeline of CPU can conceptually be simplified and divided into two: the frontend and the backend. The frontend is responsible for fetching the program code and decoding them into low-level hardware operations called micro-ops (uOps). The uOps are then fed to the backend in a process called allocation. Once allocated, the backend is responsible for executing the uOp in an available execution unit. A completion of uOp’s execution is called retirement. In contrast, a bad speculation is when speculatively fetched uOps are canceled before retiring such as in the case of mispredicted branches. Each of these metrics can further be broken down in the subsequent levels to pinpoint the bottleneck.
Tune for the Back End Bound
The majority of untuned deep learning workloads will be Back End Bound. Resolving Back End bound is often resolving sources of latency causing retirement to take longer than necessary. As shown above, Back End Bound has two sub-metrics – Core Bound and Memory Bound.
Memory Bound stalls have causes related to the memory subsystem. For example, last-level cache (LLC or L3 cache) miss causing access to DRAM. Scaling deep learning models often requires significant compute. And high compute utilization requires that data is available when the execution units need it to execute the uOps. This requires prefetching the data and reusing the data in cache instead of fetching that same data multiple times from main memory which causes execution units to be starved while data is being returned. Throughout this tutorial, we wll show that a more efficient memory allocator, operator fusion, memory layout format optimization reduce overhead on Memory Bound with better cache locality.
Core Bound stalls indicate sub-optimal use of available execution units while there are no uncompleted memory accesses. For example, several general matrix-matrix multiplication (GEMM) instructions in a row competing for fused-multiply-add (FMA) or dot-product (DP) execution units could cause Core Bound stalls. Key deep learning kernels, including the DP kernels, have been well optimized by oneDNN library (oneAPI Deep Neural Network Library), reducing overhead on Core Bound.
Operations like GEMM, convolution, deconvolution are compute-intensive. While operations like pooling, batch normalization, activation functions like ReLU are memory-bound.
Intel® VTune™ Profiler’s Instrumentation and Tracing Technology (ITT)
The ITT APIs of Intel® VTune Profiler is a useful tool to annotate a region of your workload for tracing to profile and visualize at a finer granularity of your annotation – OP/function/sub-function granularity. By annotating at the granularity of your PyTorch model’s OPs, Intel® VTune Profiler’s ITT enables op-level profiling. Intel® VTune Profiler’s ITT has been integrated into PyTorch Autograd Profiler. 1
The feature has to be explicitly enabled by with torch.autograd.profiler.emit_itt().
TorchServe with Intel® Extension for PyTorch*
Intel® Extension for PyTorch* is a Python package to extend PyTorch with optimizations for extra performance boost on Intel hardware.
Intel® Extension for PyTorch* has already been integrated into TorchServe to improve the performance out-of-box. 2 For custom handler scripts, we recommend adding the intel_extension_for_pytorch package in.
The feature has to be explicitly enabled by setting ipex_enable=true in config.properties.
Throughout this section, we will show that Back End Bound is often the primary bottleneck for under-optimized or under-tuned deep learning workloads, and demonstrate optimization techniques via Intel® Extension for PyTorch* for improving Back End Bound, which has two submetrics - Memory Bound, and Core Bound. A more efficient memory allocator, operator fusion, memory layout format optimization improve Memory Bound. Ideally, Memory Bound can be improved to Core Bound by optimized operators and better cache locality. And key deep learning primitives, such as convolution, matrix multiplication, dot-product, have been well optimized by Intel® Extension for PyTorch* and oneDNN library, improving Core Bound.
Leveraging Advanced Launcher Configuration: Memory Allocator
Memory allocator plays an important role from performance perspective. A more efficient memory usage reduces overhead on unnecessary memory allocations or destructions, and thus faster execution. For deep learning workloads in practice, especially those running on large multi-core systems or servers like TorchServe, TCMalloc, or JeMalloc can generally get better memory usage than the default PyTorch memory allocator, PTMalloc.
TCMalloc, JeMalloc, PTMalloc
Both TCMalloc and JeMalloc use thread-local caches to reduce overhead on thread synchronization, and lock contention by using spinlocks and per-thread arenas respectively. TCMalloc and JeMalloc reduce overhead on unnecessary memory allocation and deallocation. Both allocators categorize memory allocations by sizes to reduce overhead on memory fragmentation.
With the launcher, users can easily experiment with different memory allocators by choosing one of the three launcher knobs –enable_tcmalloc (TCMalloc), –enable_jemalloc (JeMalloc), –use_default_allocator (PTMalloc).
Exercise
Let’s profile PTMalloc vs. JeMalloc.
We will use the launcher to designate the memory allocator, and to bind the workload to physical cores of the first socket to avoid any NUMA complication – to profile the effect of memory allocator only.
The following example measures the average inference time of ResNet50:
import torch
import torchvision.models as models
import time

model = models.resnet50(pretrained=False)
model.eval()
batch_size = 32
data = torch.rand(batch_size, 3, 224, 224)

# warm up
for _ in range(100):
    model(data)

# measure
# Intel® VTune Profiler's ITT context manager
with torch.autograd.profiler.emit_itt():
    start = time.time()
    for i in range(100):
   # Intel® VTune Profiler's ITT to annotate each step
        torch.profiler.itt.range_push('step_{}'.format(i))
        model(data)
        torch.profiler.itt.range_pop()
    end = time.time()

print('Inference took {:.2f} ms in average'.format((end-start)/100*1000))
Let’s collect level-1 TMA metrics.
Level-1 TMA shows that both PTMalloc and JeMalloc are bounded by the backend. More than half of the execution time was stalled by the backend. Let’s go one level deeper.
Level-2 TMA shows that the Back End Bound was caused by Memory Bound. Let’s go one level deeper.
Most of the metrics under the Memory Bound identify which level of the memory hierarchy from the L1 cache to main memory is the bottleneck. A hotspot bounded at a given level indicates that most of the data was being retrieved from that cache or memory-level. Optimizations should focus on moving data closer to the core. Level-3 TMA shows that PTMalloc was bottlenecked by DRAM Bound. On the other hand, JeMalloc was bottlenecked by L1 Bound – JeMalloc moved data closer to the core, and thus faster execution.
Let’s look at Intel® VTune Profiler ITT trace. In the example script, we have annotated each step_x of the inference loop.
Each step is traced in the timeline graph. The duration of model inference on the last step (step_99) decreased from 304.308 ms to 261.843 ms.
Exercise with TorchServe
Let’s profile PTMalloc vs. JeMalloc with TorchServe.
We will use TorchServe apache-bench benchmarking with ResNet50 FP32, batch size 32, concurrency 32, requests 8960. All other parameters are the same as the default parameters.
As in the previous exercise, we will use the launcher to designate the memory allocator, and to bind the workload to physical cores of the first socket. To do so, user simply needs to add a few lines in config.properties:
PTMalloc
cpu_launcher_enable=true
cpu_launcher_args=--node_id 0 --use_default_allocator
JeMalloc
cpu_launcher_enable=true
cpu_launcher_args=--node_id 0 --enable_jemalloc
Let’s collect level-1 TMA metrics.
Let’s go one level deeper.
Let’s use Intel® VTune Profiler ITT to annotate TorchServe inference scope to profile at inference-level granularity. As TorchServe Architecture consists of several sub-components, including the Java frontend for handling request/response, and the Python backend for running the actual inference on the models, it is helpful to use Intel® VTune Profiler ITT to limit the collection of trace data at inference-level.
Each inference call is traced in the timeline graph. The duration of the last model inference decreased from 561.688 ms to 251.287 ms - 2.2x speedup.
The timeline graph can be expanded to see op-level profiling results. The duration of aten::conv2d decreased from 16.401 ms to 6.392 ms - 2.6x speedup.
In this section, we have demonstrated that JeMalloc can give better performance than the default PyTorch memory allocator, PTMalloc, with efficient thread-local caches improving Back-End-Bound.
Intel® Extension for PyTorch*
The three major Intel® Extension for PyTorch* optimization techniques, Operator, Graph, Runtime, are as shown:
Intel® Extension for PyTorch* Optimization Techniques |
||
|---|---|---|
Operator |
Graph |
Runtime |
|
|
|
Operator Optimization
Optimized operators and kernels are registered through PyTorch dispatching mechanism. These operators and kernels are accelerated from native vectorization feature and matrix calculation feature of Intel hardware. During execution, Intel® Extension for PyTorch* intercepts invocation of ATen operators, and replaces the original ones with these optimized ones. Popular operators like Convolution, Linear have been optimized in Intel® Extension for PyTorch*.
Exercise
Let’s profile optimized operator with Intel® Extension for PyTorch*. We will compare with and without the lines in code changes.
As in the previous exercises, we will bind the workload to physical cores of the first socket.
import torch

class Model(torch.nn.Module):
    def __init__(self):
        super(Model, self).__init__()
        self.conv = torch.nn.Conv2d(16, 33, 3, stride=2)
        self.relu = torch.nn.ReLU()

    def forward(self, x):
        x = self.conv(x)
        x = self.relu(x)
        return x

model = Model()
model.eval()
data = torch.rand(20, 16, 50, 100)

#################### code changes ####################
import intel_extension_for_pytorch as ipex
model = ipex.optimize(model)
######################################################

print(model)
The model consists of two operations—Conv2d and ReLU. By printing the model object, we get the following output.
Let’s collect level-1 TMA metrics.
Notice the Back End Bound reduced from 68.9 to 38.5 – 1.8x speedup.
Additionally, let’s profile with PyTorch Profiler.
Notice the CPU time reduced from 851 us to 310 us – 2.7X speedup.
Graph Optimization
It is highly recommended for users to take advantage of Intel® Extension for PyTorch* with TorchScript for further graph optimizations. To optimize performance further with TorchScript, Intel® Extension for PyTorch* supports oneDNN fusion of frequently used FP32/BF16 operator patterns, like Conv2D+ReLU, Linear+ReLU, and more to reduce operator/kernel invocation overheads, and for better cache locality. Some operator fusions allow to maintain temporary calculations, data type conversions, data layouts for better cache locality. As well as for INT8, Intel® Extension for PyTorch* has built-in quantization recipes to deliver good statistical accuracy for popular DL workloads including CNN, NLP and recommendation models. The quantized model is then optimized with oneDNN fusion support.
Exercise
Let’s profile FP32 graph optimization with TorchScript.
As in the previous exercises, we will bind the workload to physical cores of the first socket.
import torch

class Model(torch.nn.Module):
    def __init__(self):
        super(Model, self).__init__()
        self.conv = torch.nn.Conv2d(16, 33, 3, stride=2)
        self.relu = torch.nn.ReLU()

    def forward(self, x):
        x = self.conv(x)
        x = self.relu(x)
        return x

model = Model()
model.eval()
data = torch.rand(20, 16, 50, 100)

#################### code changes ####################
import intel_extension_for_pytorch as ipex
model = ipex.optimize(model)
######################################################

# torchscript
with torch.no_grad():
    model = torch.jit.trace(model, data)
    model = torch.jit.freeze(model)
Let’s collect level-1 TMA metrics.
Notice the Back End Bound reduced from 67.1 to 37.5 – 1.8x speedup.
Additionally, let’s profile with PyTorch Profiler.
Notice that with Intel® Extension for PyTorch* Conv + ReLU operators are fused, and the CPU time reduced from 803 us to 248 us – 3.2X speedup. The oneDNN eltwise post-op enables fusing a primitive with an elementwise primitive. This is one of the most popular kinds of fusion: an eltwise (typically an activation function such as ReLU) with preceding convolution or inner product. Have a look at the oneDNN verbose log shown in the next section.
Channels Last Memory Format
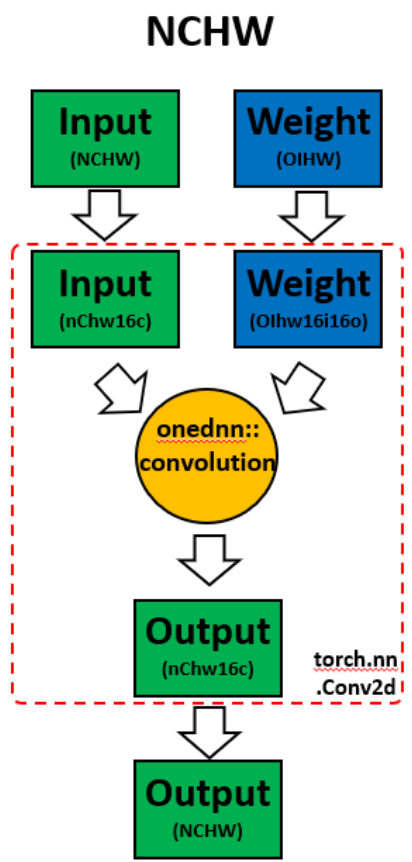
When invoking ipex.optimize on model, Intel® Extension for PyTorch* automatically converts the model to optimized memory format, channels last. Channels last is a memory format that is more friendly to Intel Architecture. Compared to PyTorch default channels first NCHW (batch, channels, height, width) memory format, channels last NHWC (batch, height, width, channels) memory format generally accelerates convolutional neural networks with better cache locality.
One thing to note is that it is expensive to convert memory format. So it’s better to convert the memory format prior to deployment once, and keep the memory format conversion minimum during deployment. As the data propagates through model’s layers the channels last memory format is preserved through consecutive channels last supported layers (for example, Conv2d -> ReLU -> Conv2d) and conversions are only made in between channels last unsupported layers. See Memory Format Propagation for more details.
Exercise
Let’s demonstrate channels last optimization.
import torch

class Model(torch.nn.Module):
    def __init__(self):
        super(Model, self).__init__()
        self.conv = torch.nn.Conv2d(16, 33, 3, stride=2)
        self.relu = torch.nn.ReLU()

    def forward(self, x):
        x = self.conv(x)
        x = self.relu(x)
        return x

model = Model()
model.eval()
data = torch.rand(20, 16, 50, 100)

import intel_extension_for_pytorch as ipex
############################### code changes ###############################
ipex.disable_auto_channels_last() # omit this line for channels_last (default)
############################################################################
model = ipex.optimize(model)

with torch.no_grad():
    model = torch.jit.trace(model, data)
    model = torch.jit.freeze(model)
We will use oneDNN verbose mode, a tool to help collect information at oneDNN graph level such as operator fusions, kernel execution time spent on executing oneDNN primitives. For more information, refer to the oneDNN Documentation.
Above is oneDNN verbose from channels first. We can verify that there are reorders from weight and data, then do computation, and finally reorder output back.
Above is oneDNN verbose from channels last. We can verify that channels last memory format avoids unnecessary reorders.
Performance Boost with Intel® Extension for PyTorch*
Below summarizes performance boost of TorchServe with Intel® Extension for PyTorch* for ResNet50 and BERT-base-uncased.
Exercise with TorchServe
Let’s profile Intel® Extension for PyTorch* optimizations with TorchServe.
We will use TorchServe apache-bench benchmarking with ResNet50 FP32 TorchScript, batch size 32, concurrency 32, requests 8960. All other parameters are the same as the default parameters.
As in the previous exercise, we will use the launcher to bind the workload to physical cores of the first socket. To do so, user simply needs to add a few lines in config.properties:
cpu_launcher_enable=true
cpu_launcher_args=--node_id 0
Let’s collect level-1 TMA metrics.
Level-1 TMA shows that both are bounded by the backend. As discussed earlier, the majority of untuned deep learning workloads will be Back End Bound. Notice the Back End Bound reduced from 70.0 to 54.1. Let’s go one level deeper.
As discussed earlier, Back End Bound has two submetrics – Memory Bound and Core Bound. Memory Bound indicates the workload is under-optimized or under-utilized, and ideally memory-bound operations can be improved to core-bound by optimizing the OPs and improving cache locality. Level-2 TMA shows that the Back End Bound improved from Memory Bound to Core Bound. Let’s go one level deeper.
Scaling deep learning models for production on a model serving framework like TorchServe requires high compute utilization. This requires that data is available through prefetching and reusing the data in cache when the execution units need it to execute the uOps. Level-3 TMA shows that the Back End Memory Bound improved from DRAM Bound to Core Bound.
As in the previous exercise with TorchServe, let’s use Intel® VTune Profiler ITT to annotate TorchServe inference scope to profile at inference-level granularity.
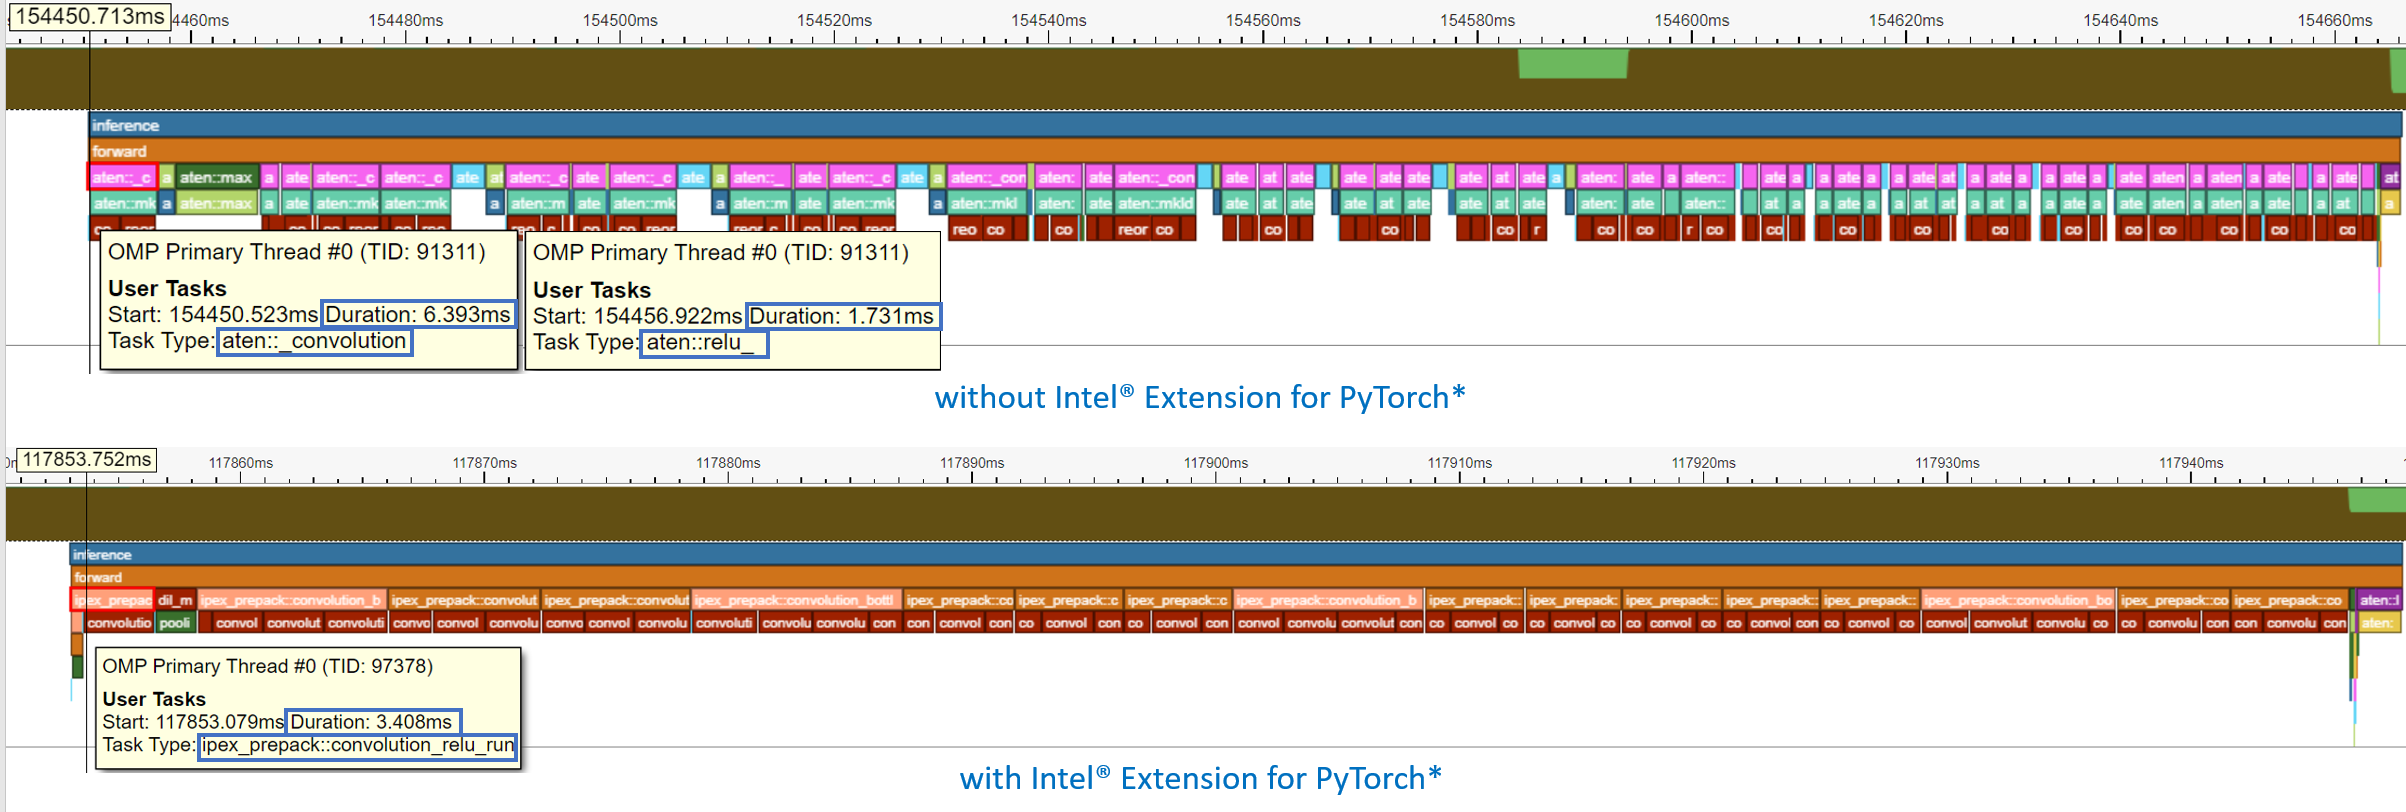
Each inference call is traced in the timeline graph. The duration of the last inference call decreased from 215.731 ms to 95.634 ms - 2.3x speedup.
The timeline graph can be expanded to see op-level profiling results. Notice that Conv + ReLU has been fused, and the duration decreased from 6.393 ms + 1.731 ms to 3.408 ms - 2.4x speedup.
Conclusion
In this tutorial, we have used Top-down Microarchitecture Analysis (TMA) and Intel® VTune™ Profiler’s Instrumentation and Tracing Technology (ITT) to demonstrate that
Often the primary bottleneck of under-optimized or under-tuned deep learning workloads are Back End Bound, which has two submetrics, Memory Bound and Core Bound.
A more efficient memory allocator, operator fusion, memory layout format optimization by Intel® Extension for PyTorch* improve Memory Bound.
Key deep learning primitives, such as convolution, matrix multiplication, dot-product, etc have been well optimized by Intel® Extension for PyTorch* and oneDNN library, improving Core Bound.
Intel® Extension for PyTorch* has been integrated into TorchServe with an ease-of-use API.
TorchServe with Intel® Extension for PyTorch* shows 7.71x throughput speedup for ResNet50, and 2.20x throughput speedup for BERT.
Acknowledgement
We would like to thank Ashok Emani (Intel) and Jiong Gong (Intel) for their immense guidance and support, and thorough feedback and reviews throughout many steps of this tutorial. We would also like to thank Hamid Shojanazeri (Meta) and Li Ning (AWS) for their helpful feedback in code review and the tutorial.


